Contents:
There won’t be any business insights if the data quality is poor.
When preparing data, we often go through many different approaches to reach a level of quality of data that can provide accurate results. In this article, we describe how unsupervised Machine Learning can improve data quality in machine learning projects and how it helps to get more accurate business insights.
What’s Wrong with Traditional Data Preparation Approaches?
For accurate predictions, the data must not only be properly labeled, de-deputed, broad, consistent, etc. The point is that the machine learning model should process the “right” data. It is not entirely clear what are the criteria of the “right” data.
When data scientists prepare the data, they often require a domain expert assisting in data categorization and labeling. If taking into account the majority of machine learning projects, there are often no domain experts available for such tasks. Here, the correctness of data may fail due to the wrong understanding of the final output expected from the ML model, incorrect categorization of data, and human error. In such a case, the ML model might output the wrong result at the very beginning and cause further errors in the future.
One more question is whether the expected result is really something that might add value when optimizing business processes. What if the initial hypothesis is wrong? Here we mean cases when there is some underlying structure of data that neither product owner nor data scientists know about.
Anyhow, data scientists spend up to 80% of their time cleaning the gathered data before training the ML model, which is not a guarantee of the entire absence of errors and bias. That is why it is often difficult to reach the ideal data quality and meet all the data standard requirements. And that’s how we came to unsupervised machine learning approaches.
What is Unsupervised Machine Learning?
Before reviewing unsupervised machine learning, let’s define what supervised learning is. Supervised learning is the machine learning task of learning a function that maps an input to an output based on example input-output pairs. It infers a function from labeled training data consisting of a set of training examples. These labeled training data is useful for the ML model since then it differentiates data categories more accurately. The measure for the model’s performance, in this case, is defined from the beginning, and it is clear what can be considered as an “accurate” output. The possible consequences of such an approach are described in the previous paragraph.
In unsupervised machine learning, there are no data labels outlined, and we cannot measure the performance of an algorithm. The algorithm detects a deep structure of data on its own and distributes a dataset into different categories. The algorithm is commonly chosen according to business goals, and if performed correctly, the business solution is tenfold more powerful than a supervised learning-based one.
The unsupervised ML algorithm does not have predefined tasks and may detect hidden data patterns that we may not have known about. Also, it’s better to use unsupervised ML when aiming to find new patterns in future data, thus, optimizing the ML-based solution in advance.
Unsupervised ML Approaches to Define the Underlying Structure of Data
Unsupervised approaches are mostly focused on the finding of the underlying data structure. Here we describe the most often used approaches.
Dimensionality Reduction Algorithm
Dimensionality reduction is the ML method used to identify patterns in data and deal with computationally extensive problems. This method includes a set of algorithms aimed to reduce the number of input variables in a dataset by projecting the original high-dimensional input data to a low-dimensional space. Dimensionality reduction is helpful when working with visual and audio data involving speech, video, images, or text, and also when simplifying datasets in order to better fit a predictive model. There are many examples of dimensionality reduction algorithms, but I’d like to emphasize UMAP, which we found useful when working on one of the machine learning projects.
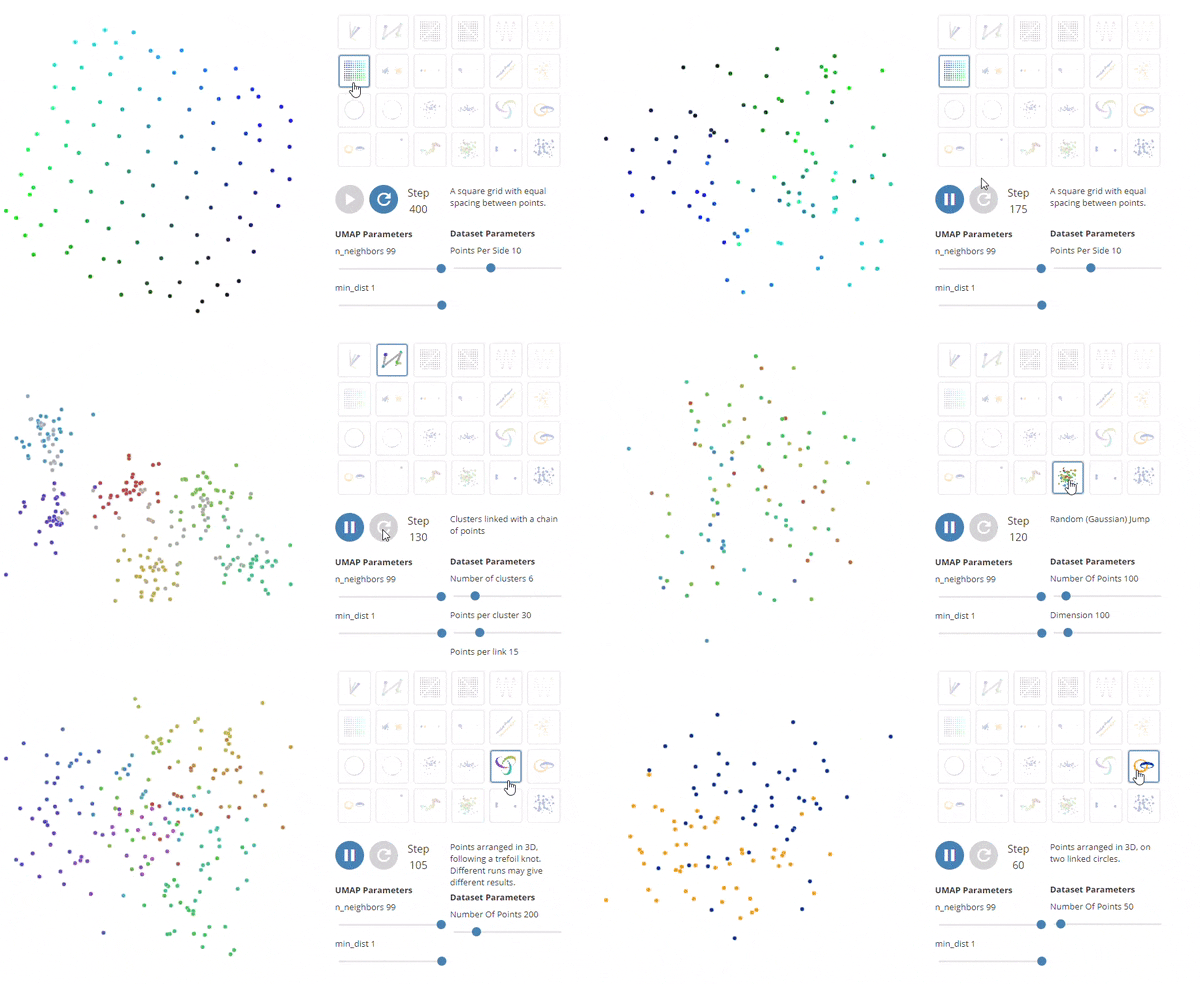
UMAP (Uniform Manifold Approximation and Projection) algorithm allows the construction of a high dimensional graph representation of data and further optimization of a low-dimensional graph to be as structurally similar as possible.
The main feature of this algorithm is the nonlinear representation of data. Compared to other dimensionality reduction algorithms, it is good at scaling dimensionality and size of a dataset and fast projection. For example, UMAP can project the 784-dimensional, 70,000-point MNIST dataset in less than 3 minutes, compared to 45 minutes for scikit-learn’s t-SNE implementation.
UMAP projection to various toy datasets, powered by umap-js
Data Clustering
Clustering allows defining a structure in a set of unlabeled data. Simply put, it organizes data into groups (clusters), basing on its similarity and dissimilarity. This approach is applicable for market and customer segmentation, recommendation engines, document classification, fraud identification, and other cases.
The goal of clustering is to detect distinct groups in an unlabeled dataset, where the users are expected to determine the criteria of what is a “correct” cluster so that clustering results meet their expectations.
The example of Clustering algorithm in action
There are many clustering algorithms, including KNN, K-means, Gaussian Mixture Model, and others, but here I’d like to emphasize two algorithms that have proven their high performance in our practice: DBSCAN and HDBSCAN.
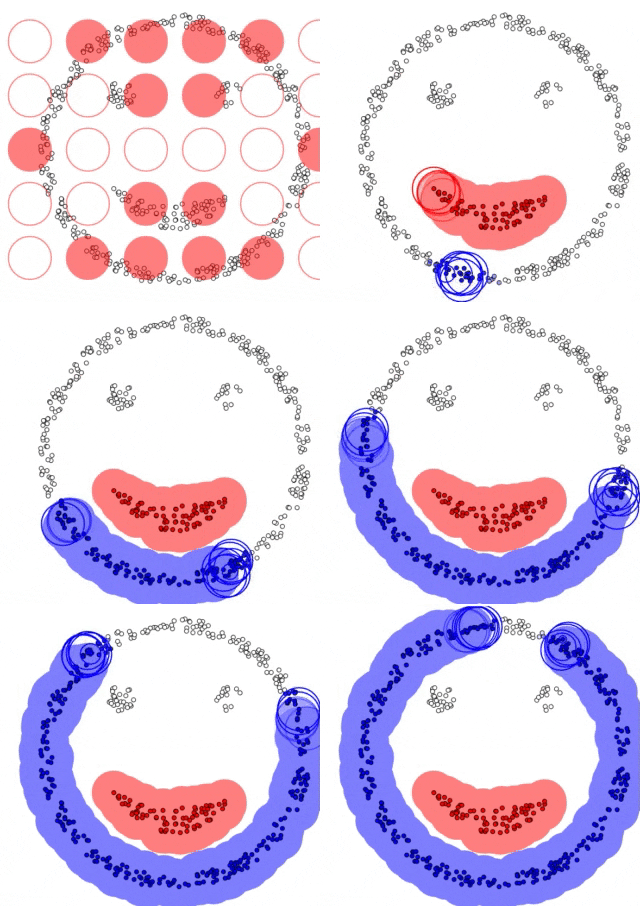
DBSCAN (density-based spatial clustering of applications with noise) algorithm takes all instances that are close to each other and groups them together, based on a distance measurement and a minimum number of instances specified by a data science engineer. Since the distances within multiple clusters are specified, clusters will contain those instances which are most densely located. If some instance is located out of the specified distance, and not belongs to any cluster, it will be labeled as an outlier.
DBSCAN clustering visualization: Smiley Face
This algorithm is good at finding those data structures and associations that can be useful to define patterns and predict trends. For example, when developing recommendation engines, the DBSCAN algorithm can be applied to customer databases in order to find the most demanded products of specific users.
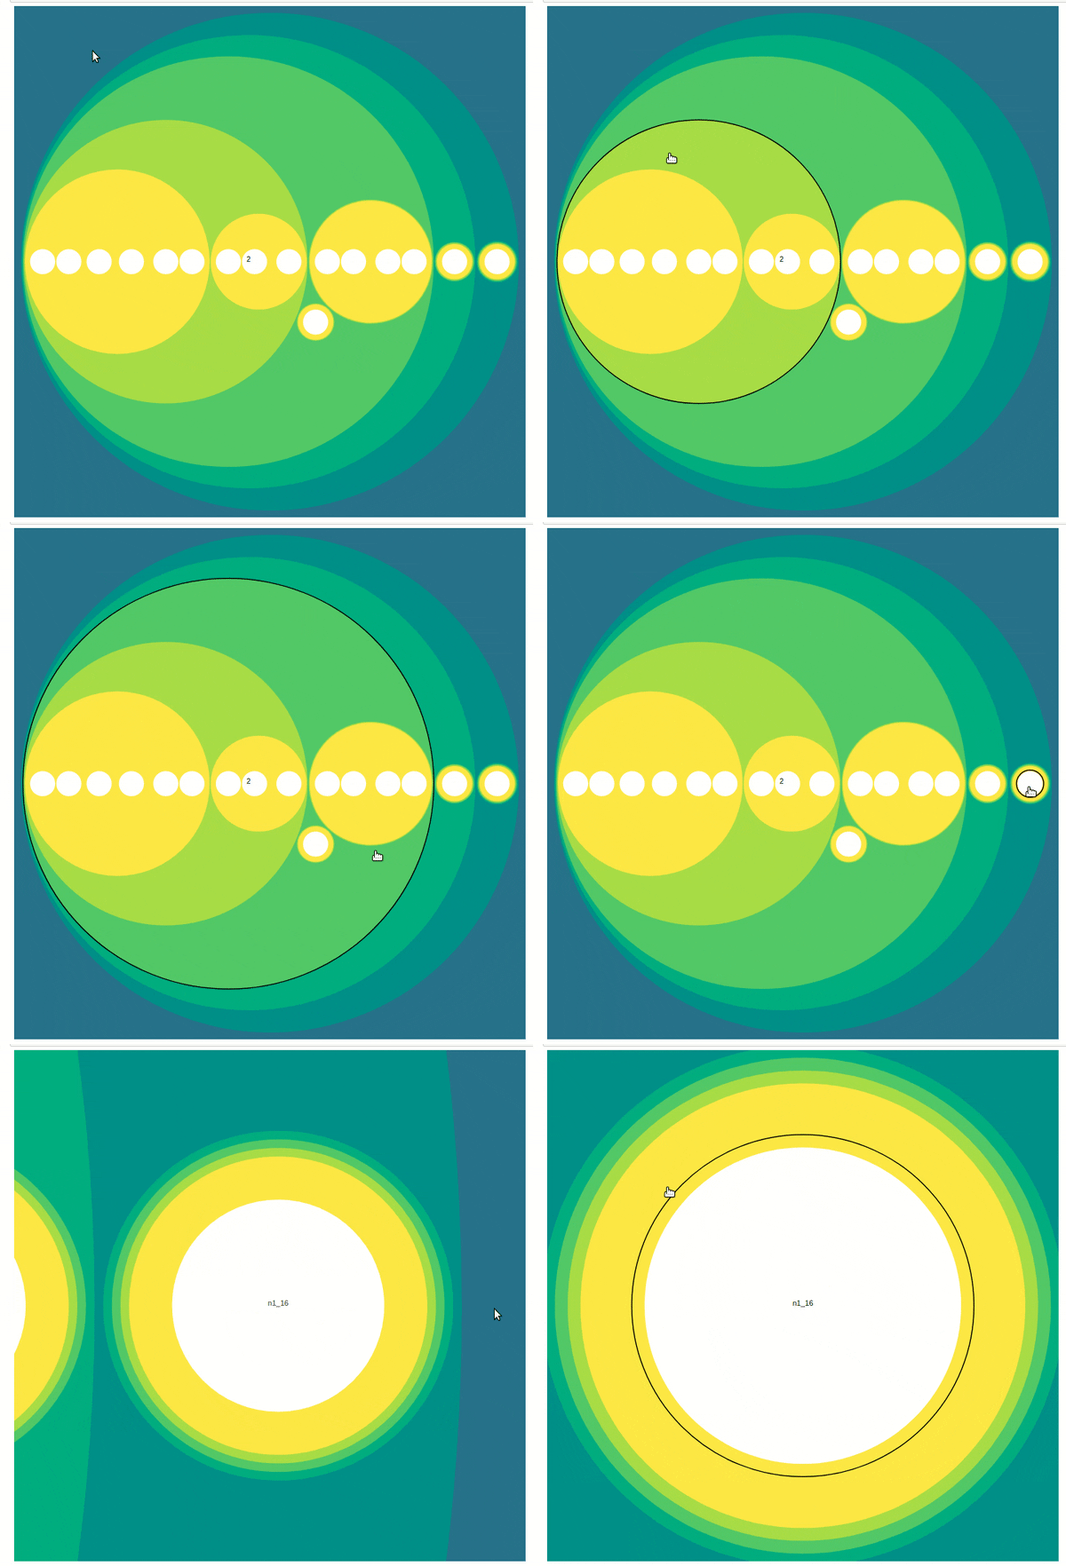
HDBSCAN (Hierarchical Density-Based Spatial Clustering of Applications with Noise) algorithm converts the DBSCAN into a hierarchical manner and extracts a flat clustering based on the stability of clusters.
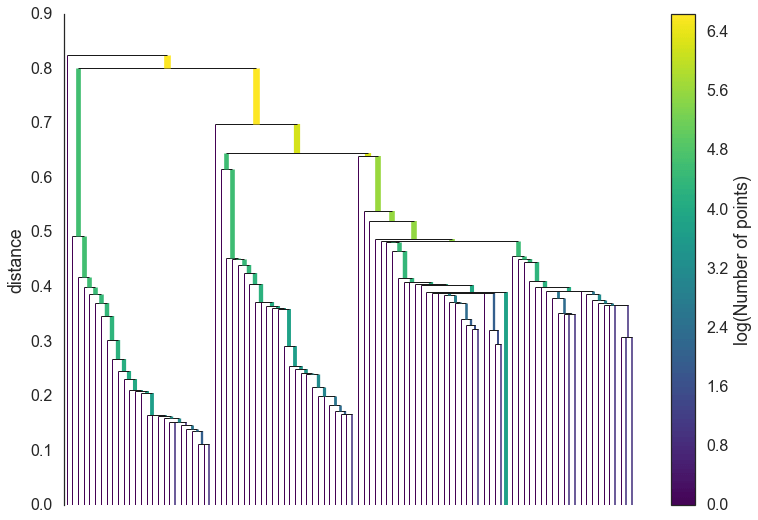
HDBSCAN clustering algorithm
Firstly, the HDBSCAN algorithm changes the space according to the density or sparsity, creates the minimum tree of the distance weighted graph, and constructs a cluster hierarchy of connected components. Based on the minimum cluster size, the algorithm condenses the cluster hierarchy and, finally, extracts the stable clusters from the condensed tree.
Anomaly Detection Algorithm
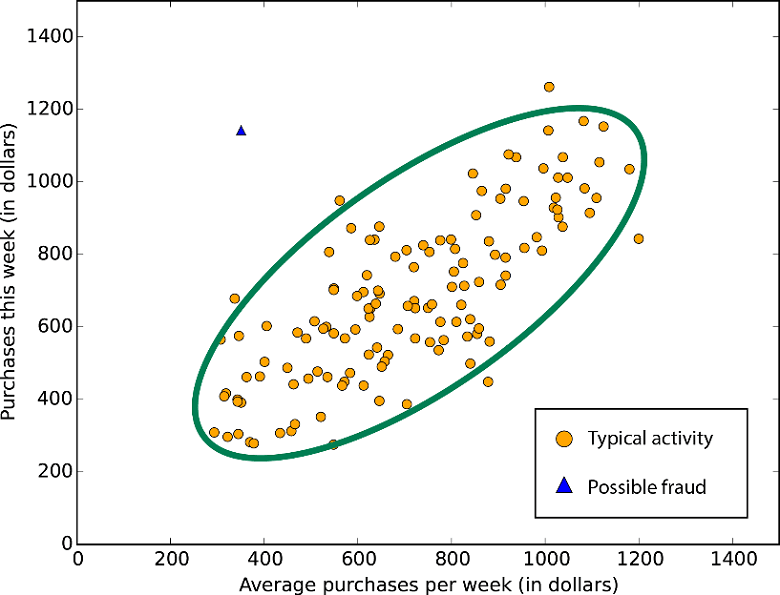
The anomaly detection algorithm is not independent itself. It often goes along with the dimensionality reduction and clustering algorithms. By using the dimensionality reduction algorithm as a pre-stage for anomaly detection, we, firstly, transform high-dimensional space into a lower-dimensional one. Then we can figure out the density of the major data points in this lower-dimensional space, which may be identified as “normal.” Those data points located far away from the “normal” space are outliers or “anomalies.”
The clustering algorithm is often used to improve the analysis of anomalies. It allows grouping of similar anomalies and further manual categorization based on their behavior types. By following such a process, we can use unsupervised ML algorithms to detect anomalies, cluster them, provide labels to each cluster manually; thus, getting business insights we couldn’t have predicted.
A good example of anomaly detection is spam filtering, where the ML algorithm analyzes all incoming messages, clusters them, and detects spam messages as outliers. It is also extensively used for fraud detection in financial, insurance, IT, and other spheres.
The example of Anomaly Detection algorithm
This algorithm is also a part of ML-based predictive maintenance systems in manufacturing. By detecting anomalies in the system behavior, this algorithm allows the prediction of equipment failures before they occur.
Association Mining Algorithm
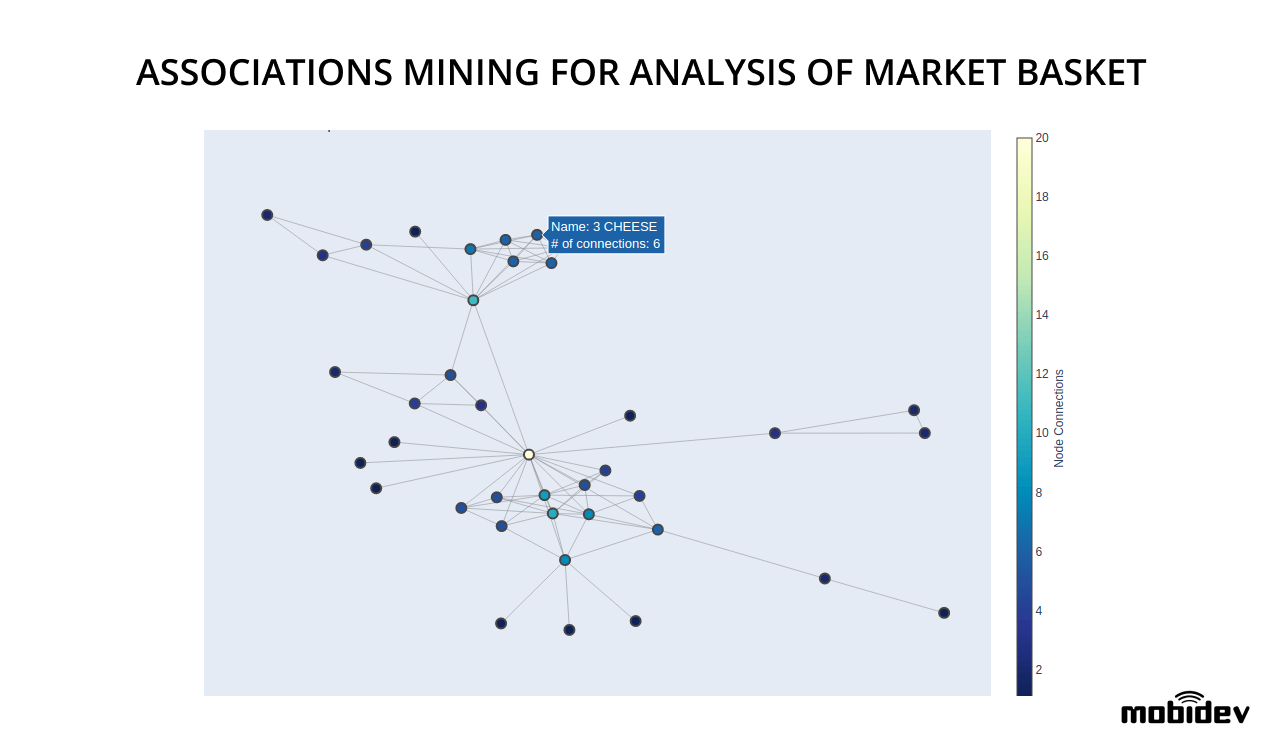
Association mining is the unsupervised ML algorithm used to identify hidden relationships in large datasets which frequently occur together. Compared to most ML algorithms that process numeric data, association mining can deal with non-numeric, categorical data, which means that it requires more actions than simple counting.
This algorithm is commonly used to identify patterns and associations in transactional, relational, or any similar database. For example, it is possible to build the ML algorithm, which will analyze the market basket through the processing of data from barcode scanners, and define goods purchased together.
In the healthcare sphere, the association mining may be for setting a correct diagnosis. By processing symptom characteristics and various illness factors and defining associations, we may predict disease probability. Moreover, if adding new symptoms in the future, finding relationships between the new data and diseases is possible.
In the public sector, the association mining algorithm can be used for census data processing. As a result, it may help to optimize the planning of public services and businesses such as transport, education, health, setting up new shopping malls, and factories.
Unsupervised ML Business Cases
Let’s review a couple of real-life business cases where we used unsupervised ML.
Cloud Computing. Hardware Performance Comparison
One of our projects involved the usage of unsupervised ML algorithms to compare the performance of virtual machines. Since the project area was a bit tough for understanding, we decided not to use any labels because they might be subjective, but rather build an independent system; thus, we did the following:
- Created the virtual machine on the cloud
- Benchmarked it via running different tests in order to measure the performance of VM
- Collected about 2000 characteristics as raw data
- Analyzed the gathered raw data and extracted the most valuable benchmarks
- Compressed benchmarks into several coefficients (parallelization, one core, stability, database, RAM)
- Calculated the custom coefficient as a balance between the performance and price
- Selected the best instance type based on their characteristics and price
The process described above is a good example of dimensionality reduction technique since we didn’t include all the characteristics to the system but the collapsed information which could be considered as “representative” in terms of results.
Human Labeling Evaluation and Automation
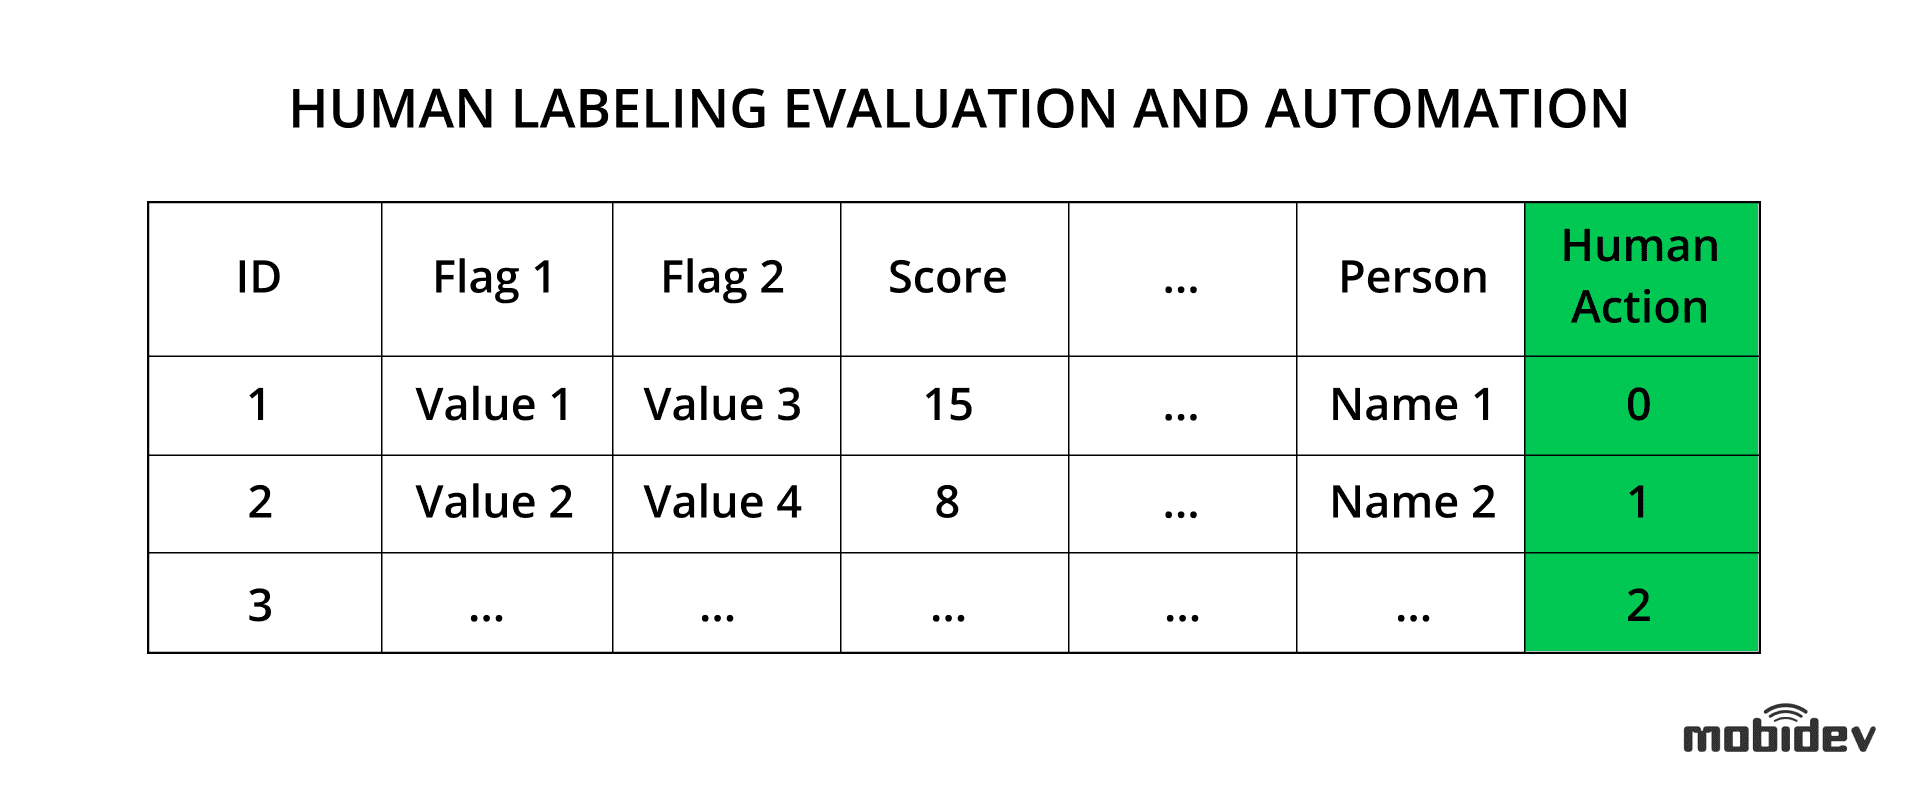
The project involved the evaluation of human labels, which is now a tough task in data science. We had to find the best ways to evaluate the quality of human labels. Having the data about individuals and legal entities, we should divide it into three classes, analyze it, find specific labels, and predict labeling accuracy.
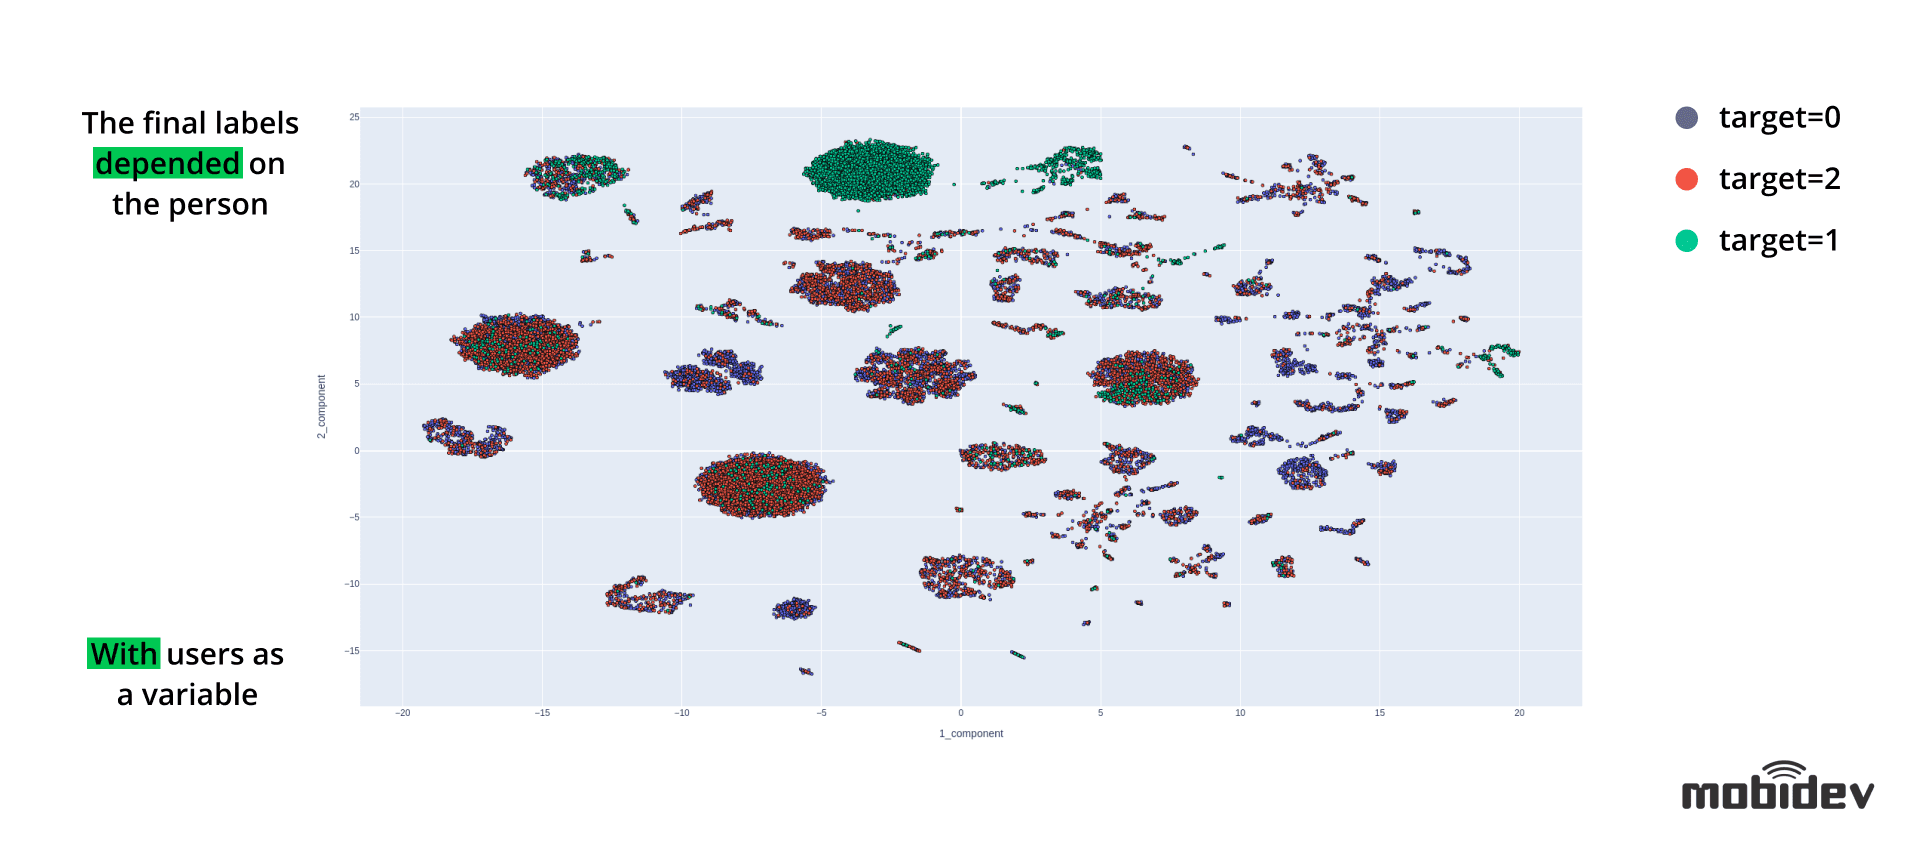
We set the human action label based on specific characteristics, constructed the classifier, and evaluated the quality of these labels.
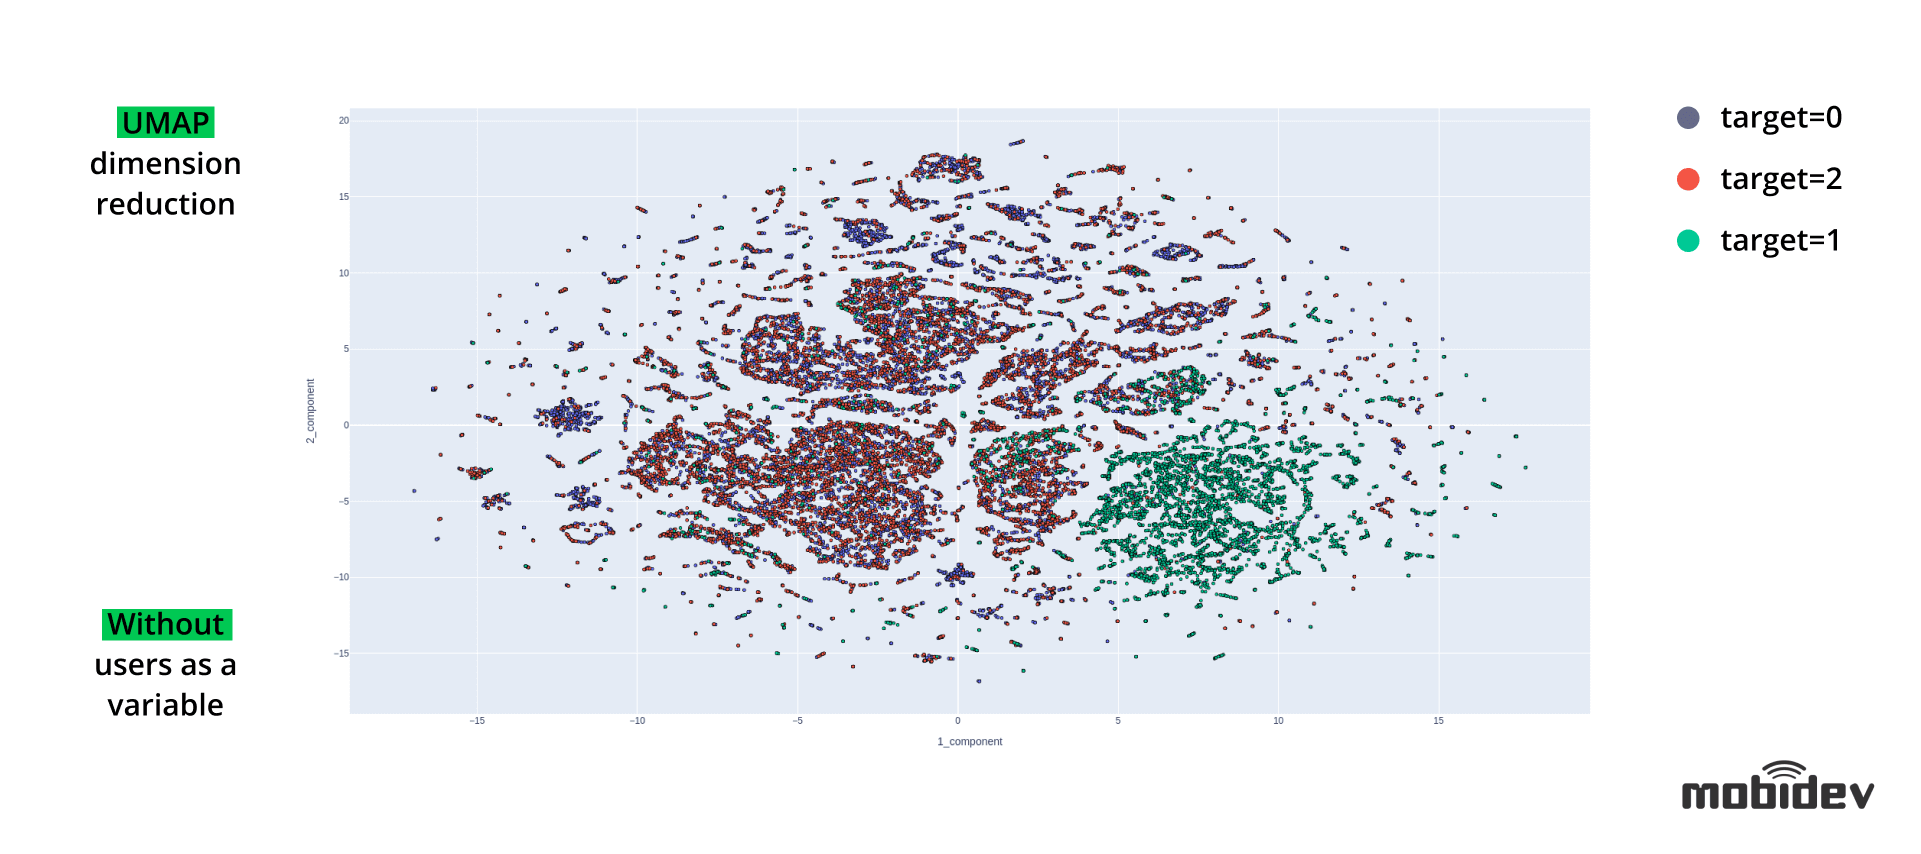
As you can see from the graph above, it’s almost impossible to divide classes without users as a variable because they are too close to each other according to the characteristics and their labels.
But let’s take a look at this chart with the data where we included users as a variable, where the final human action labels were dependent on the person.
By adding a person into that algorithm, we could achieve the best results. The important thing here is that the data should be independent, which means that it should not have relationships with the person interested in labeling. Thereby, we concluded that there was no proper way to proceed with classification tasks, and it’s better to use raw data.
In conclusion, we would say that there is no perfect path for any business case. And unsupervised machine learning is just a tool for getting expected results. It will work well if you are sure that it meets your business requirements.
Highlights:
- Unsupervised machine learning still requires a good quality of data to be processed, although not labeled.
- A proper data preparation approach drives “right” business insights by improving their accuracy.
- Unsupervised machine learning algorithms should be chosen depending on a particular business case, not on the popularity of a specific approach and trends.
- The goal of Data Science and machine learning consulting is to tackle business problems, but not Data Science ones.
